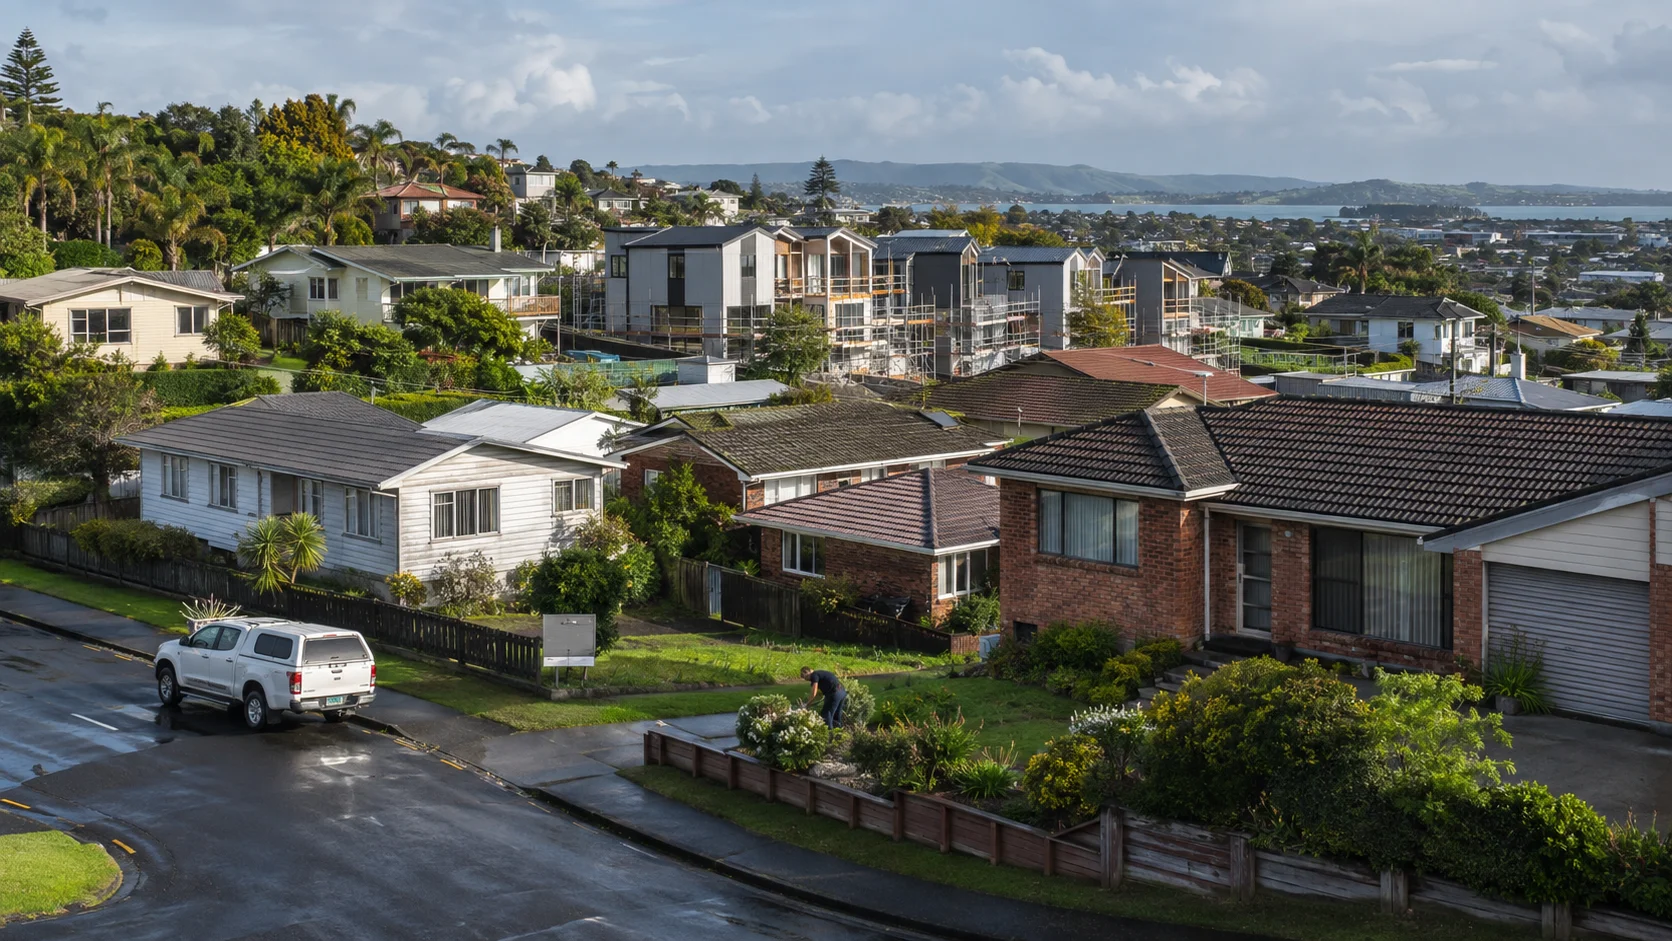
What is happening in Tauranga's residential market?
QV's July 2026 House Price Index put Tauranga's average home value at $1,052,045. The index increased 0.7% over the three months to the end of July, 1.8% from the start of 2026 and 2.0% over the year.
QV described Tauranga as the only main North Island centre with quarterly value growth in that release. That is evidence of relative resilience, not a forecast. QV's figure is a modelled average across the city, so it cannot show what one home, suburb or price band would achieve.
House values and completed sales measure different things
The QV index tracks estimated residential values. A completed-sale measure records properties that actually sold, while an asking price records what a seller requested before negotiation. Those measures can move differently because they cover different properties and different stages of the market.
Property mix matters. A month with more expensive coastal or recently built homes changing hands can lift a median even if like-for-like prices are steady. Low sales volumes can also make a short-period result less representative of the wider city.
For an individual selling decision, use relevant settled sales as the closer evidence. The Real Estate Authority says a written appraisal must reflect current market conditions and be supported by comparable sales. Our guide to reading appraisal evidence explains how to test those comparisons.
How much choice do Tauranga buyers have?
No suitably licensed Tauranga inventory series is reproduced in this update. QV's national commentary described buyers as cautious, but a city value index does not measure the number of active listings or the bargaining position for every property. Sellers should compare the homes a likely buyer can choose in the same location, property type and price range.
Is Tauranga adding enough housing?
In a report considered on 10 March 2026, Tauranga City Council recorded 337 new dwellings consented from July to December 2025. The comparable period a year earlier recorded 247.
The Council attributed much of the increase to medium-density townhouse developments, particularly in the Pāpāmoa and Te Papa wards. This changes the future supply mix as well as the total number of proposed homes.
Stats NZ recorded 1,690 new dwellings consented across Bay of Plenty in the year ended July 2026, compared with 1,424 in the previous year. The regional figure covers more than Tauranga City, so it provides context rather than a city total.
A consent is permission for proposed work. It is not a completed or occupied home. The supply pipeline can affect future buyer choice, particularly where new townhouses compete with established homes, but completion timing and the final number delivered remain separate questions.
What is happening in the rental market?
Tenancy Services publishes monthly rental bond data, with the current files covering activity to June 2026. The data records private bonds and new-tenancy activity rather than every rent paid in Tauranga.
Recent bond data is provisional because migration to a new management system has introduced revisions and classification changes. Tenancy Services warns that recent releases may not be directly comparable with earlier periods. For that reason, this update does not turn the current bond series into a confident rental-growth claim.
What can these city figures tell a Tauranga homeowner?
The QV result provides a dated view of city-wide value movement. Council and Stats NZ consent figures describe proposed future supply. Together they show a resilient value signal and a growing supply pipeline, but they do not calculate a sale price.
Test the wider signals against recent comparable sales, competing listings and the response to your campaign. A townhouse near a large new development can face different competition from a character home, an apartment or a property with a scarce harbour outlook.
If a move depends on sale proceeds, use the move-scenario planner to test your own figures. Then follow the Tauranga selling steps to place appraisal evidence, preparation and campaign decisions in the right order.
Value movement compared
Tauranga moved against the national direction.
QV House Price Index movement to the end of July 2026.
Three months
One year
Positive bars extend right of zero. Negative bars extend left. A city-wide index does not predict the result for one property.
Questions Tauranga homeowners often ask
Is Tauranga currently a buyer's or seller's market?
The evidence reviewed on 5 September 2026 was mixed. Tauranga's average QV value increased over the three months to July 2026, while cautious buyers and wider national weakness limit what that movement says about an individual campaign.
Is the QV average value the likely sale price of my home?
No. It is a modelled city-wide average. A property appraisal needs current market conditions, relevant comparable sales and explained differences between those properties and yours.
Do building consents mean more homes are already for sale?
No. A consent approves proposed work. It does not prove that construction has started, finished, been occupied or reached the resale market.
Sources and reporting periods
Reviewed 5 September 2026. The QV figures cover the three months and year to July 2026. Council figures cover July to December 2025. Stats NZ figures cover Bay of Plenty for the year ended July 2026. Rental bond files cover activity to June 2026 and remain provisional.
Use the evidence
Apply the local signals to your own situation.
Build a private Selling Plan, compare appraisal evidence and identify the next practical actions for your property.
Keep the public guide
Share the article or save a private PDF.
No account is needed to read or share this guide. A private seller account is only needed to create its personalised A4 PDF.
Optional seller account
Take the useful work to another device.
Sign in to access the planning information saved to your account on another device and save personalised guide PDFs. Your saved plan and calculator results are not included in introduction requests.